Viz Extensions
Features
All Viz Extensions

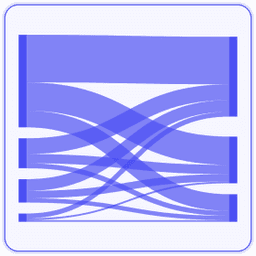
Sankey
by Tableau
Sankey Diagram is used to show the flow of data between multiple categories.
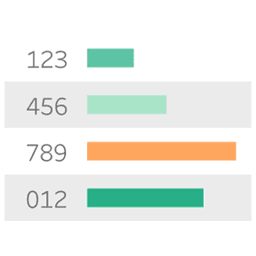
Tableau Table
by Tableau
Create a rich table experience with conditional formatting directly in Tableau.
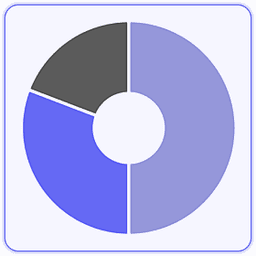
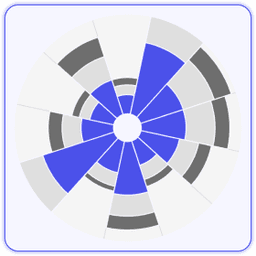
Radial
by Tableau
Displays data in a circular format in which the total of all segment values add up to 100%.
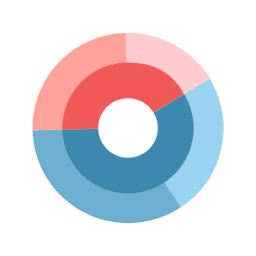
Donut
by LaDataViz
Create a Donut chart without any hacks
Tree Diagram
by LaDataViz
Create beautiful radial, horizontal, or vertical Tree Diagrams
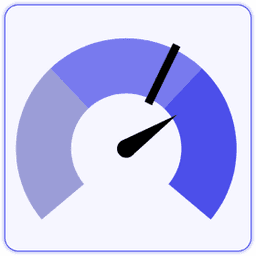
Gauge
by LaDataViz
Create a fully customizable Gauge with a single drag-and-drop
SuperTables
by Infotopics | Apps for Tableau
Let users analyze and discover the data to support your visuals in stunning interactive tables.

Radar Chart
by Infotopics | Apps for Tableau
A graphical method of displaying multivariate data in the form of a two-dimensional chart

Waterfall Chart
by Infotopics | Apps for Tableau
A waterfall chart visually shows the cumulative effect of sequential changes on a starting value.

PowerKPIs
by Infotopics | Apps for Tableau
Integrate strategic insights into your Tableau dashboards with PowerKPIs
Sankey Diagram
by Infotopics | Apps for Tableau
Highly customizable Sankey Diagram to visualize flow of a measure across multiple dimensions.
Radar
by LaDataViz
Compare performances with our beautiful Radat Chart extension
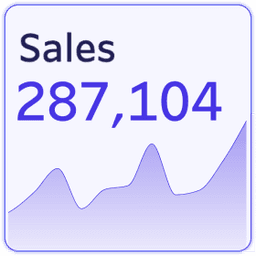
KPI Card (BANs)
by LaDataViz
Create a stunning KPI Card without any calculations in a single worksheet
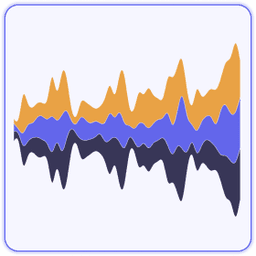
Streamgraph
by LaDataViz
Display time-series data with a beautiful and engaging Streamgraph
DrillDownTree
by Infotopics | Apps for Tableau
Visualize and aggregate data across multiple dimensions - drill down in any order.

Zoomable Sunburst
by Infotopics | Apps for Tableau
A hierarchical visualization that represents data in a radial layout
Sunburst (zoomable)
by Actinvision
The Sunburst Diagram is used to visualize hierarchical data using concentric circles.
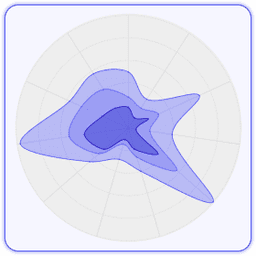
Polar Area / Nightingale
by LaDataViz
Compare dimensions beautifully with a Polar Area chart (also called Coxcomb or Nightingale Rose)

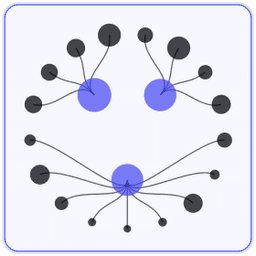
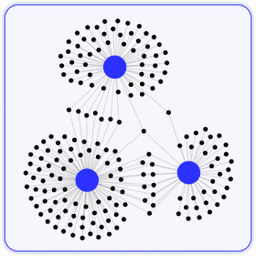
Network Diagram
by Infotopics | Apps for Tableau
A highly customizable Network Diagram that allows users to understand relationships in data.
Heatmap
by Actinvision
Les cartes de chaleur permettent de visualiser les données à travers les variations de couleur
Beeswarm
by LaDataViz
Show the distribution of your data with a Beeswarm chart
Network
by LaDataViz
Display complex relationships with our easy-to-use Network extension
Radar
by Actinvision
Un graphique en radar hautement personnalisable

Venn Diagram
by Infotopics | Apps for Tableau
A graphical representation used to illustrate the relationships between sets of data.
Entonnoir
by Actinvision
Un graphique en entonnoir simple et personnalisable.
Sankey - Draggable
by LaDataViz
Create beautiful Sankey Diagrams and move the nodes around to create your perfect layout
Graphique radial
by Actinvision
Un graphique radial à barres affichés sur des plans à coordonnées polaires.

Sunburst Diagram
by Infotopics | Apps for Tableau
Shows hierarchy through a series of rings, that are sliced for each category node.
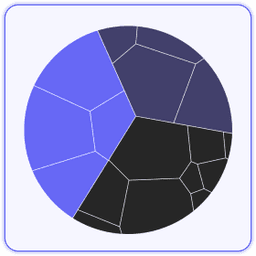
Voronoi Treemap
by LaDataViz
Give a twist to the way you visualize hierarchical data with a Voronoi Treemap!
Recursive Sankey Diagram
by Infotopics | Apps for Tableau
Visualizes the flow of a particular set of data from its origin to its destination.
Line Chart
by LaDataViz
Create beautiful and modern Line charts with multiple styles (curves, area, gradients)
DashPets
by Infotopics | Apps for Tableau
Transform data into a cute cat, happy dog, or cool T-Rex. Filter, interact, and have fun!
Radial Sankey
by LaDataViz
Show the flow between sources and targets in an elegant Radial Sankey
Bump Chart
by LaDataViz
Easily track the ranking changes with a stunning Bump chart

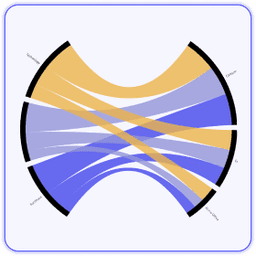
Chord Diagram
by Infotopics | Apps for Tableau
Illustrate the relationships and connections between entities in a network or system.
PictureThis Free
by Infotopics | Apps for Tableau
The Picture This extension helps you create dynamic image tables/cards based on your data.
Drill Down Filter
by LaDataViz
Add an advanced drop-down filter menu to your Dashboard in two minutes
Chord
by LaDataViz
Easily visualize flow and connections with our Chord Diagram extension
Waterfall & KPI Tree: What's driving my variations?
by DataMa
Discover the WHY behind your KPIs variation with Datama for Tableau

Anomaly Detection
by DataMa
Find anomalies in trend lines for multiple metrics and dimensions at the same time

Circular Sankey Diagram
by Infotopics | Apps for Tableau
Visualize the flow of a measure over multiple dimensions with internal loops.
Table
by Actinvision
Un affichage sous forme de table simple et efficace pour vos données.

Globe Path
by LaDataViz
Display animated arcs between origin and destination points on a 3D spinning globe

Marginal Histogram
by Infotopics | Apps for Tableau
Allow users to visualize both distributions and relationships between variables in a single view

Assess Significance
by DataMa
Quickly assess the statistical significance of differences on any KPI between two points.
ProcessMining Free
by Infotopics | Apps for Tableau
Visualize and analyze your processes based on log file extractions
Bullet
by Actinvision
L’extension ultra personnalisable pour graphiques à puces d’Actinvision
WriteBackExtreme Free
by Infotopics | Apps for Tableau
Collaborate directly from your Tableau Dashboards with WriteBackExtreme.
Isotype
by Actinvision
Utilisez des images pour faire parler vos données
Nightingale+
by Actinvision
Visualisation circulaire qui met en évidence la magnitude relative des catégories
Date Picker
by Actinvision
Make it simple to focus on specific timeframes or compare different periods

Funnel Chart
by Infotopics | Apps for Tableau
Flexible funnel small multiples for stage progression, conversion, grouping, and target tracking.

Area Bump
by LaDataViz
Visualize how rankings and category dominance change over time

Calendar chart
by Infotopics | Apps for Tableau
Plot values by day in a calendar grid to reveal seasonality and temporal patterns.

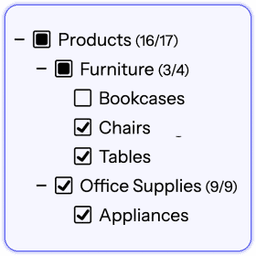
HierarchyFilter
by Infotopics | Apps for Tableau
Replace multiple dashboard filters with one intuitive hierarchy filter.

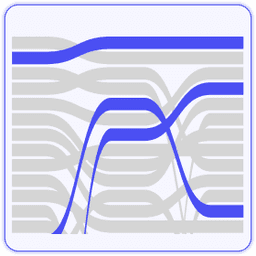
Small Multiples
by Infotopics | Apps for Tableau
Repeat the same chart across panels to compare trends consistently and quickly.
Gauge chart
by Infotopics | Apps for Tableau
Show one or many KPI gauges with radial, speedometer, or traffic-light layouts.

Tree Diagram
by Infotopics | Apps for Tableau
Visualize hierarchical reporting structures with flexible layouts and node-level detail.

Easy KPI Cards
by IP Faustov Aleksandr
Create beautiful, interactive KPI cards in Tableau — in seconds.

Streamgraph
by Infotopics | Apps for Tableau
Show changing composition over time with flowing, stacked series around a centerline.

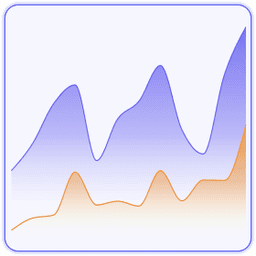
Horizon Chart
by Infotopics | Apps for Tableau
Compress long time-series into compact bands for dense trend comparison.
%20(1).png&w=256&q=75)
Dimensions & Metrics Explorer
by DataMa
This extension enables interactive KPI breakdowns with multi-dimensional, multi-metric views.
Error Bars
by Actinvision
The Error Chart displays values and uncertainties to visualize deviations and confidence intervals.

HierarchyFilter
by Infotopics | Apps for Tableau
Replace multiple dashboard filters with one intuitive hierarchy filter.
Tournament Bracket
by LaDataViz
Build stylish tournament-style bracket diagrams to follow the progression of your favorite team